How to create universal Zabbix template to monitor custom Linux process defined by name.
1. Create new Zabbix template
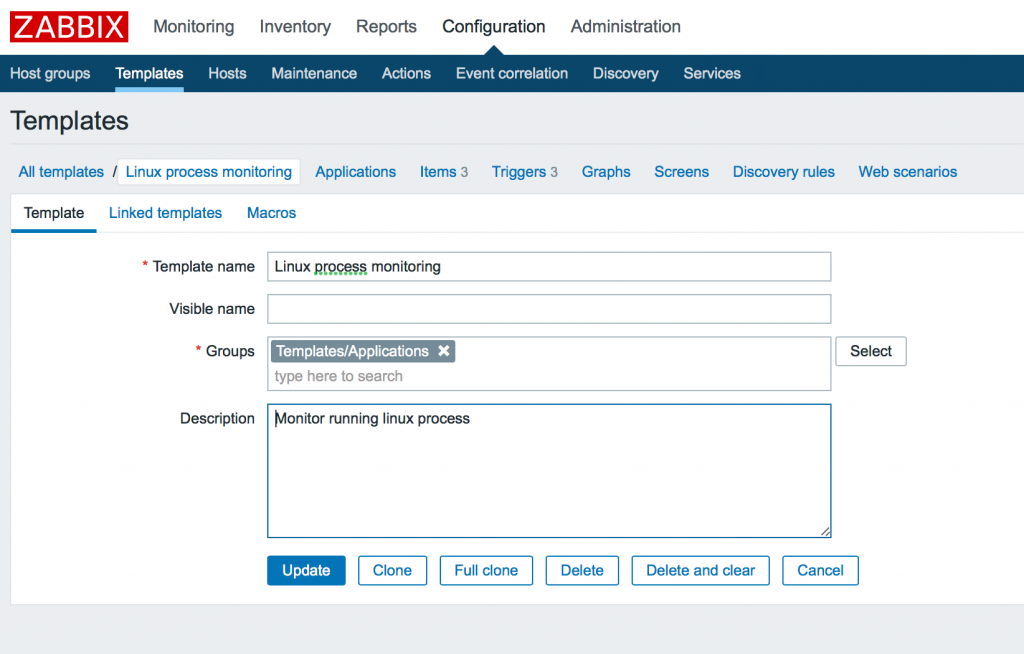
Go to Configuration -> Templates -> Create template and add your template name, group and description.
2. Add macros
We want to monitor this three parameters:
- number of process, with alerting if it less than a certain value
- memory usage, with alerting on high usage
- cpu usage, with alerting on high load
So, let’s create default values for it. We can use macros as placeholders to be able re-define this values in host configuration.
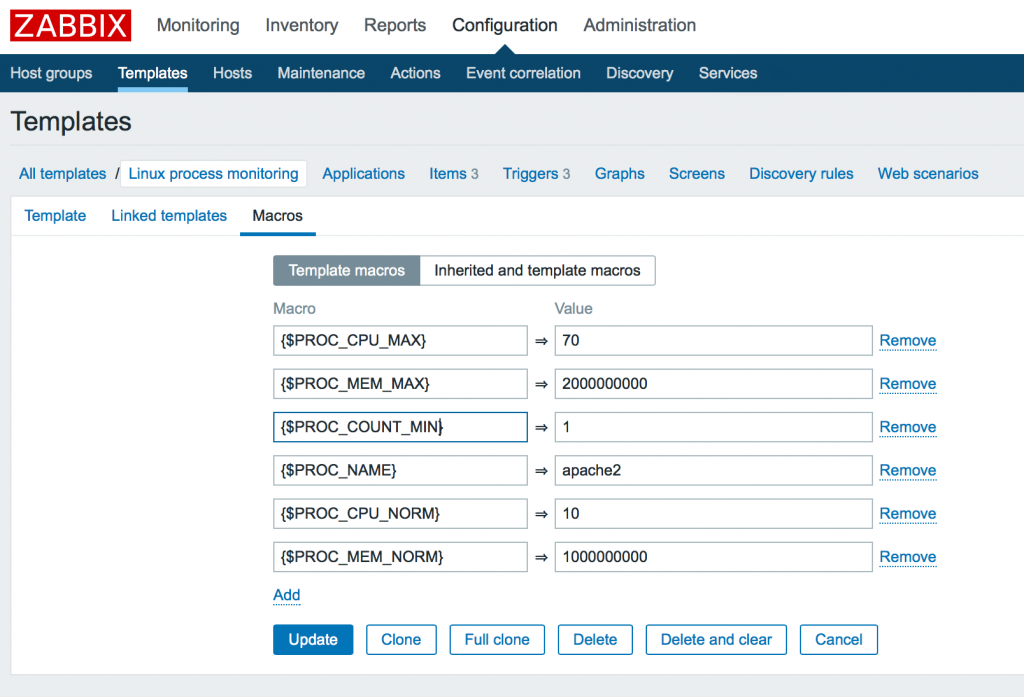
In this example we created 6 macros:
{$PROC_CPU_MAX} => 70
{$PROC_MEM_MAX} => 2000000000
{$PROC_COUNT_MIN} => 1
{$PROC_NAME} => apache2
{$PROC_CPU_NORM} => 10
{$PROC_MEM_NORM} => 1000000000
Here you can see cpu max usage 70%, max memory limit 2G, minimum 1 process running and process name apache2 for example. But we should also define normal values for trigger hysteresis to avoid flapping state (see below). So we also defined {$PROC_CPU_NORM} as 10% and {$PROC_MEM_NORM} as 1G.
3. Add items
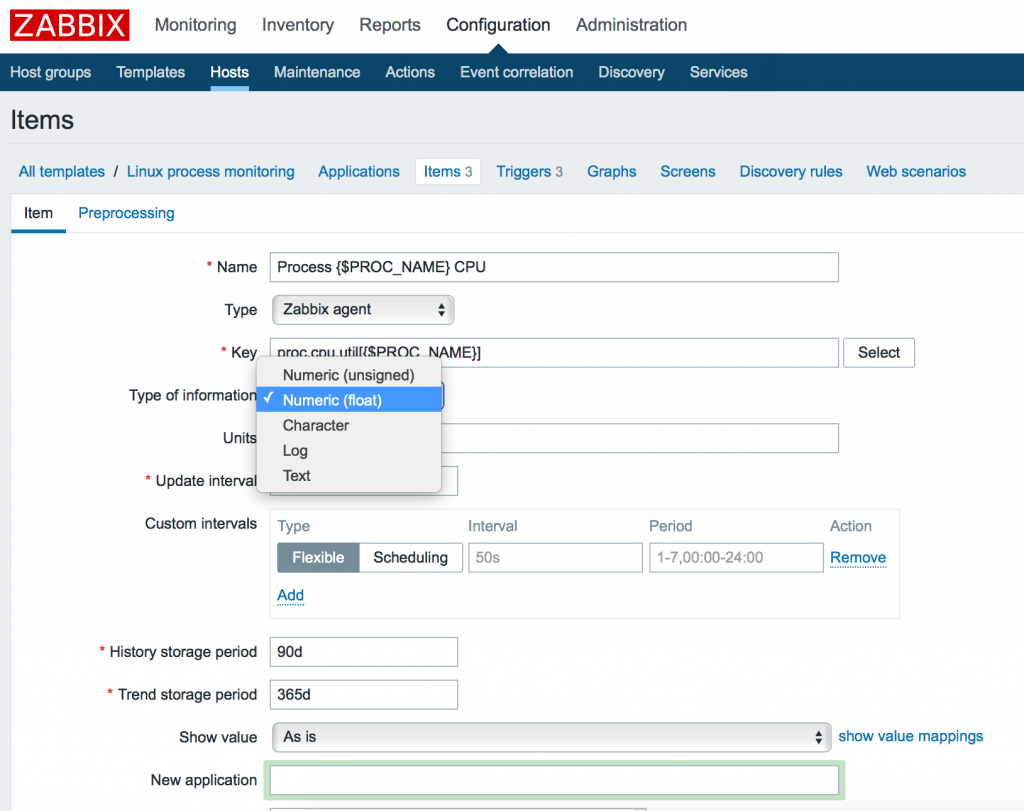
Now we need to add incoming data items. Go to Items menu under current template and click Create item button. Create 3 items:
- number of process
- cpu usage
- memory usage
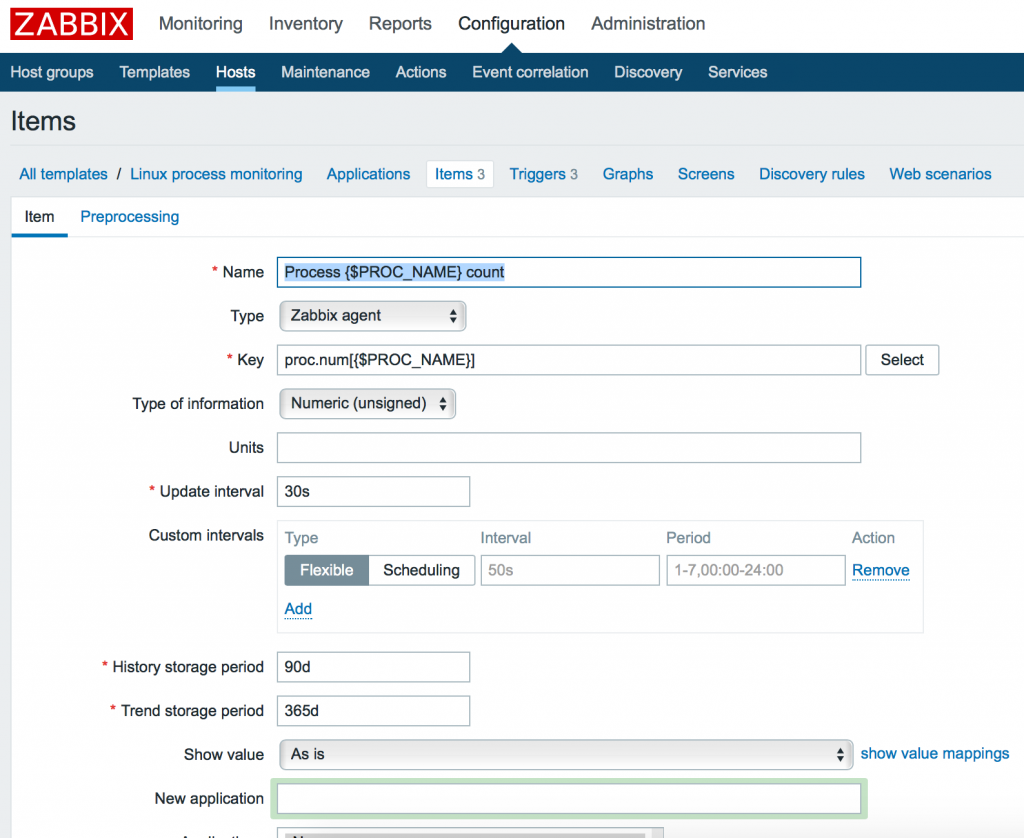
You can use macros {$PROC_NAME} as placeholder of process name to be able to change it in host configuration. So add this 3 items with 3 Keys:
proc.num[{$PROC_NAME}]
proc.cpu.util[{$PROC_NAME}]
proc.mem[{$PROC_NAME}]
Be careful, some parameters have different value types. For example proc.num, proc.mem has Numeric (int), but proc.cpu.util has Numeric (float). You can check it in Key -> Select constructor or official Zabbix documentation.
4. Triggers with hysteresis
Now we need to create triggers. Let’s construct it. Go to template Triggers menu. You can use built-in Zabbix constructor by clicking Problem expression -> Add button, select item and function. For example last (most recent) T value. But it’s only one value. It can change every time. To detect hard status, when same value will repeat several times, it is better to use count function. You can get more information about functions on Zabbix official documentation.
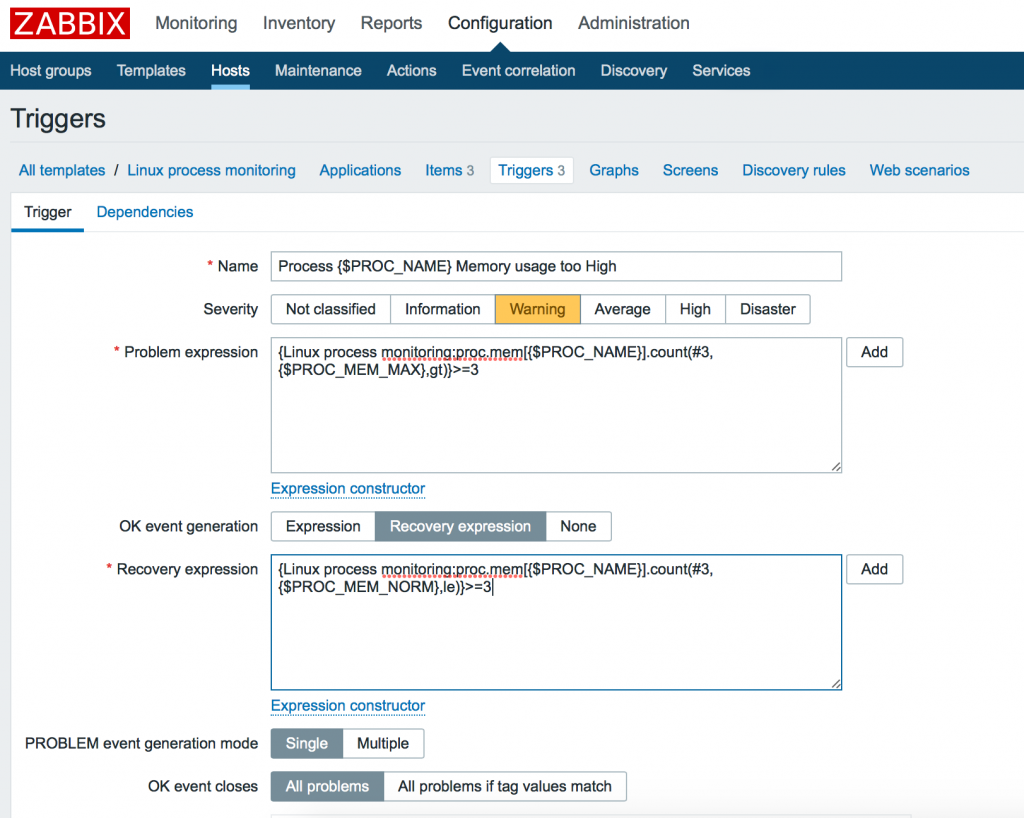
So we want to create trigger problem expression which will be fired when memory usage will greater than {$PROC_MEM_MAX} 3 times in a row.
{Linux process monitoring:proc.mem[{$PROC_NAME}].count(#3,{$PROC_MEM_MAX},gt)}>=3
You can read this expression as: “count of last 3 values (#3) which greater (gt) than {$PROC_MEM_MAX} was >= 3 times”. This is means that last (most recent) 3 item values was greater then PROC_MEM_MAX 3 times in a row. So each of this three values was greater than the maximum. It is good solution to detect hard state of the problem.
But what about return to normal state? If we leave only one problem expression alone – we can get situation like this:
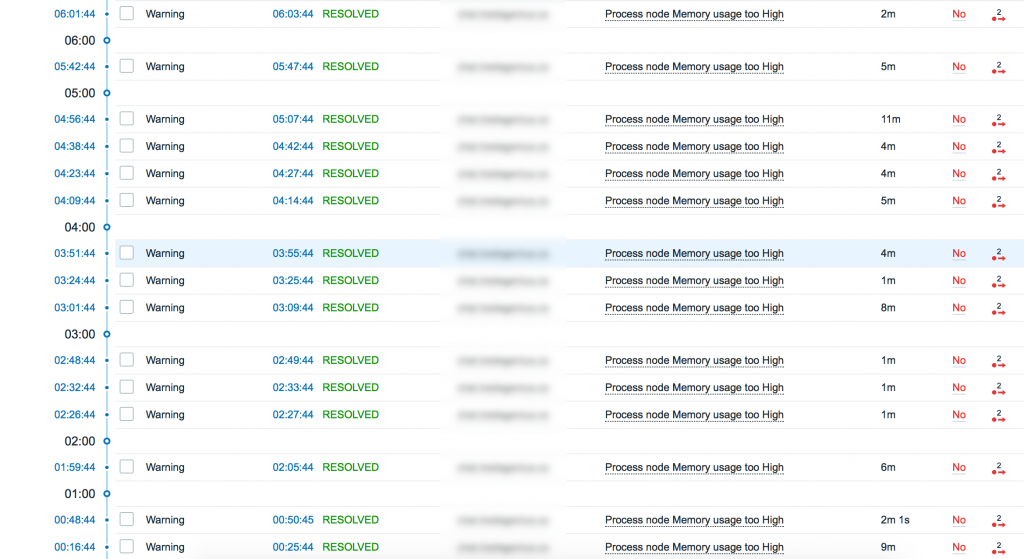
Every 5-10 minutes it’s flapping between greater and less than critical value! It get 3 overloaded values and fire a trigger, then it get 3 normal values and mark trigger as RESOLVED! What we shall do? We need to create hysteresis with normal value. Trigger will be in PROBLEM state till item value will decrease to ${PROC_MEM_NORM}.
So click to OK event generation -> Recovery expression and add this expression:
{Linux process monitoring:proc.mem[{$PROC_NAME}].count(#3,{$PROC_MEM_NORM},le)}>=3
You can read this expression like: count of last #3 item values which less or equivalent (le) than {$PROC_MEM_NORM} was >= 3 times.
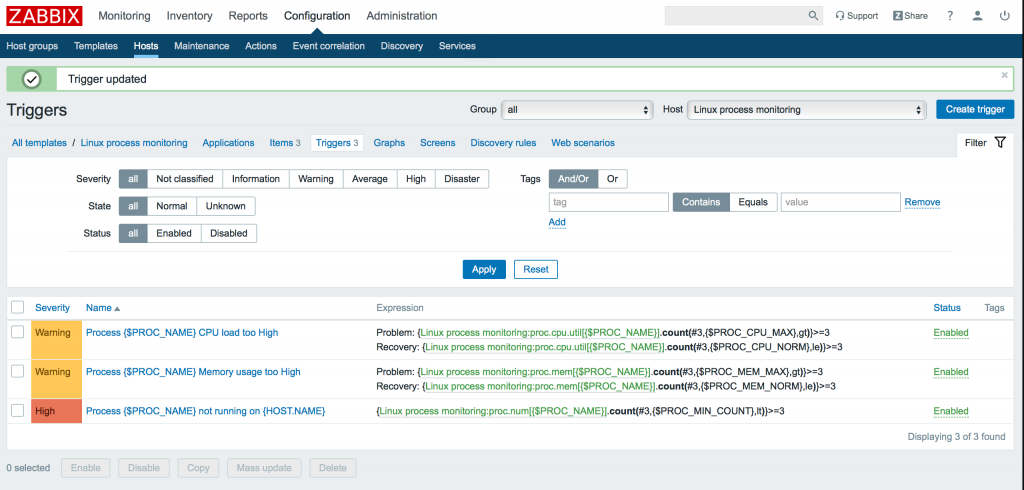
Now you can add according expressions to other triggers (MEM and Number of process):
{Linux process monitoring:proc.mem[{$PROC_NAME}].count(#3,{$PROC_MEM_MAX},gt)}>=3
{Linux process monitoring:proc.mem[{$PROC_NAME}].count(#3,{$PROC_MEM_NORM},le)}>=3

{Linux process monitoring:proc.cpu.util[{$PROC_NAME}].count(#3,{$PROC_CPU_MAX},gt)}>=3
{Linux process monitoring:proc.cpu.util[{$PROC_NAME}].count(#3,{$PROC_CPU_NORM},le)}>=3

{Linux process monitoring:proc.num[{$PROC_NAME}].count(#3,{$PROC_COUNT_MIN},lt)}>=3
{Linux process monitoring:proc.num[{$PROC_NAME}].count(#3,{$PROC_COUNT_MIN},ge)}>=3
5. Configure host
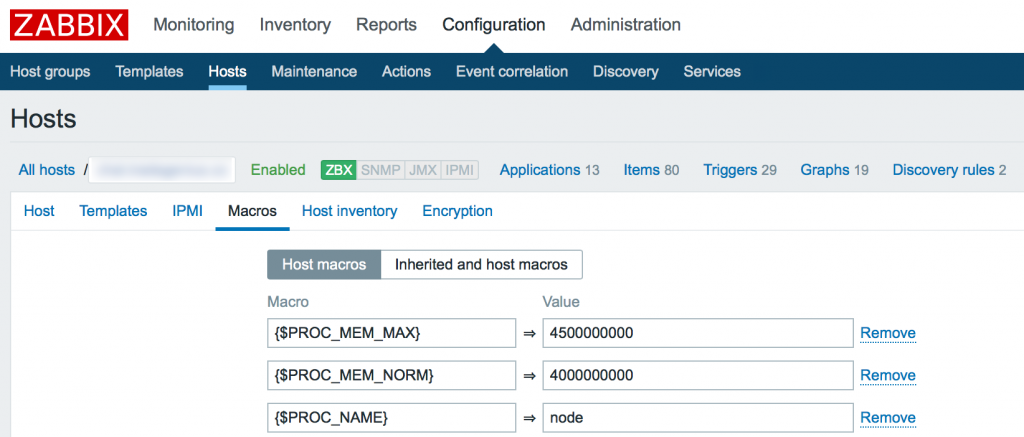
Now we can add this template into our host. Go to Configuration -> Hosts -> your server -> Templates. And add your brand new template into server. Then we need to add according macros.
For example we want to monitor node (node.js) process on server. Let’s look at one of my node server memory usage Graph.
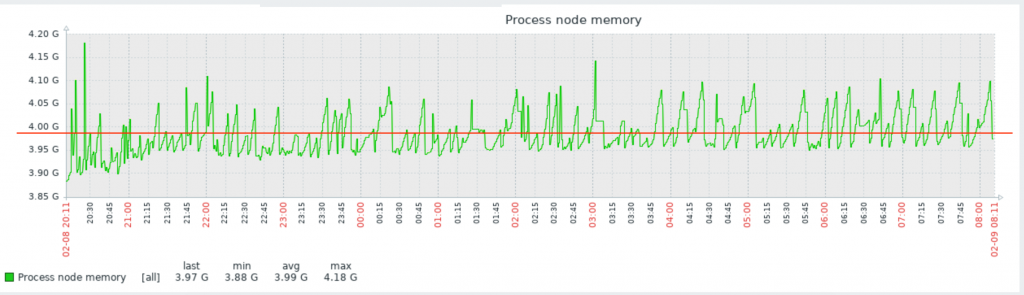
In this Graph you can see that process require about 4Gb of RAM. It is normal usage (for my service). You can also see a flapping state around the red line. So in this example my hysteresis minimum should be less than red line, and maximum – greater than 4.20G, for example at 4,5G. Let’s set this values in host’s macros.
So, my trigger will fired PROBLEM state when node process will use greater than 4,5Gb RAM 3 times in a row. And return into normal state only when memory will return to less than 4Gb 3 times in a row.
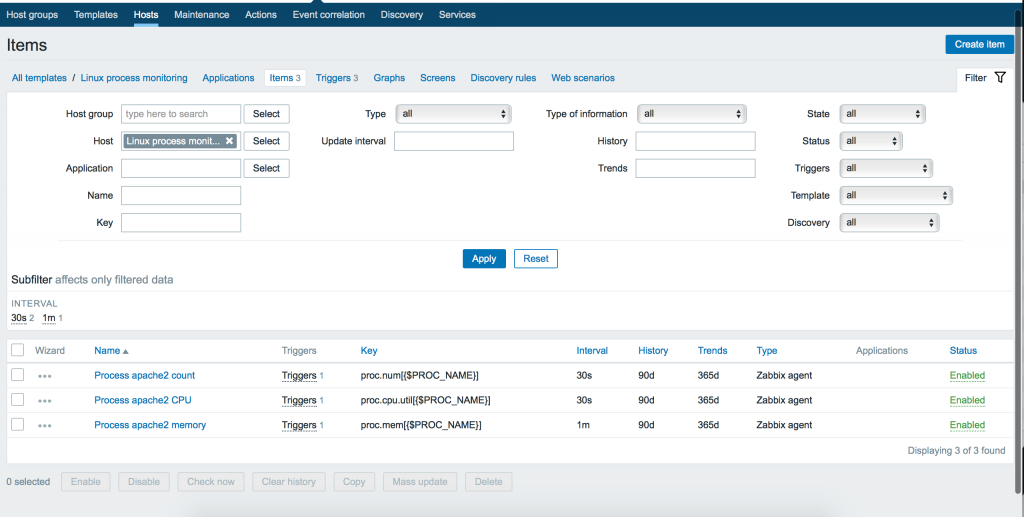
All done! Congratulations! Now we can check our data in Monitoring -> Latest data menu.
You can also download ready to use template here : linux-process.zip
Good luck!