How to add a new custom serviceMonitor in Prometheus?
Here is example with PostgreSQL monitoring by Prometheus and Grafana as a Helm deployment in Kubernetes environment.
Posgresql
-
We will use this helm chart: https://github.com/helm/charts/tree/master/stable/postgresql It has built-in prometheus metric exporter (as additional container in pod).
-
Turn on metrics settings in
values.yaml:
metrics:
  enabled: true
  serviceMonitor:
    enabled: true
Or if you are using helmfile like me, add these values:
    - name: metrics.enabled
      value: true
    - name: metrics.serviceMonitor.enabled
      value: true
- Deploy postgresql:
helm install -f postgres-values.yaml stable/postgresql
- Ensure that postgresql metrics service is available. In my example it’s a gitea-db-postgresql release:
kubectl get services | grep metrics
gitea-db-postgresql-metrics    ClusterIP      10.0.2.193    <none>           9187/TCP
Prometheus
-
We will use a helm chart from: https://github.com/helm/charts/tree/master/stable/prometheus-operator
-
By default prometheus will discover only the same namespace which it has been deployed. So if you want to run prometheus in different namespace, you need to mark available namespaces with labels. For example a new label prometheus=enabled.
kubectl label --overwrite namespace --all "prometheus=enabled"
Then turn on serviceMonitorNamespaceSelector in values.yaml:
prometheus:
  prometheusSpec:
    serviceMonitorNamespaceSelector:
       matchLabels:
         prometheus: enabled
- Checkout postgresql metrics service:
kubectl describe service gitea-db-postgresql-metrics
Name:              gitea-db-postgresql-metrics
Namespace:         default
Labels:            app=postgresql
                   chart=postgresql-6.2.0
                   heritage=Tiller
                   release=gitea-db
Annotations:       prometheus.io/port: 9187
                   prometheus.io/scrape: true
Selector:          app=postgresql,release=gitea-db,role=master
Type:              ClusterIP
IP:                10.0.2.193
Port:              metrics  9187/TCP
TargetPort:        metrics/TCP
Endpoints:         10.52.3.156:9187
Session Affinity:  None
Events:            <none>
- Add postgresql serviceMonitor support in prometheus values.yaml file based on description above:
prometheus:
  prometheusSpec:
    additionalServiceMonitors:
    - name: "postgresql"
      namespaceSelector:
        any: true
      selector:
        matchLabels:
            app: postgresql
      endpoints:
      - port: "metrics"
      - targetPort: "metrics/TCP"
        scheme: tcp
- Deploy prometheus:
helm install -f prometheus-values.yaml stable/prometheus-operator
And check /targets url. You can find something like this:
monitoring/postgresql/0 (1/1 up)
Endpoint    State   Labels  Last Scrape     Scrape Duration     Error
http://10.52.3.156:9187/metrics
    up  endpoint="metrics" instance="10.52.3.156:9187" job="gitea-db-postgresql-metrics" namespace="default" pod="gitea-db-postgresql-0" service="gitea-db-postgresql-metrics"
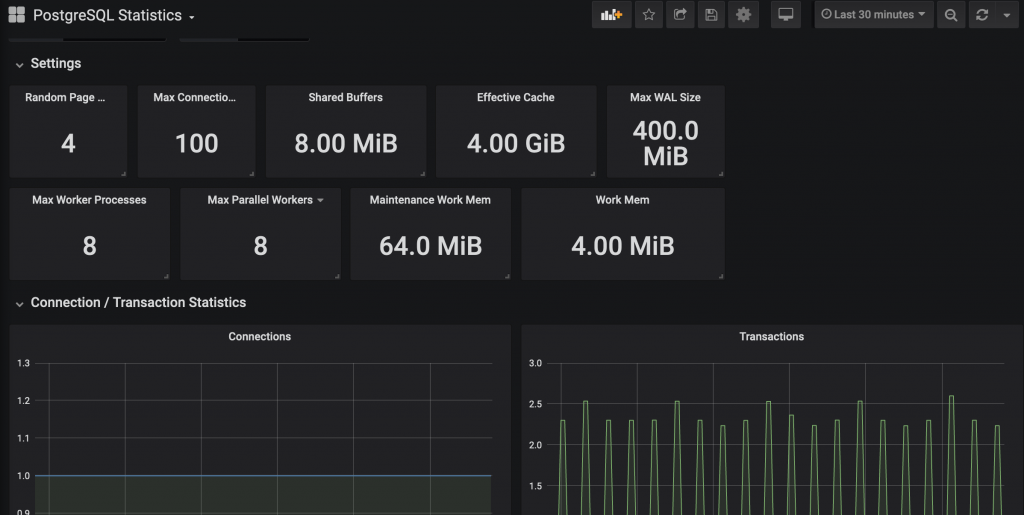
Grafana
To install a custom dashboards automatically I’m using existing script: prometheus-operator/hack/sync_grafana_dashboards.py but with small changes. I replaced existing charts with my own. For example for postgresql:
...
-        'source': 'https://raw.githubusercontent.com/etcd-io/etcd/master/Documentation/op-guide/grafana.json',
-        'destination': '../templates/grafana/dashboards',
+        'source': 'https://raw.githubusercontent.com/sinsengumi/grafana-dashboards/master/postgresql_statistics.json',
+        'destination': '../templates/grafana/dashboards/custom',
         'type': 'json',
         'min_kubernetes': '1.10.0-0',
         'max_kubernetes': '1.14.0-0'
     },
...
I also fixed some naming issues:
@@ -77,7 +57,7 @@ header = '''# Generated from '%(name)s'
 apiVersion: v1
 kind: ConfigMap
 metadata:
-  name: {{ printf "%%s-%%s" (include "prometheus-operator.fullname" $) "%(name)s" | trunc 63 | trimSuffix "-" }}
+  name: {{ printf "%%s-%%s" (include "prometheus-operator.fullname" $) "%(name)s" | lower | replace "_" "-" | trunc 63 | trimSuffi
x "-" }}
   labels:
     {{- if $.Values.grafana.sidecar.dashboards.label }}
     {{ $.Values.grafana.sidecar.dashboards.label }}: "1"
Now you need to run this script to download json files and convert it into Helm ConfigMap yaml file.
I also changed old ${DS_PROMETHEUS} placeholder to Prometheus
for files in ../templates/grafana/dashboards/custom/*.yaml
do
        echo "fixing $files..."
        sed 's#${DS_PROMETHEUS}#Prometheus#g' -i $files
done
Now you can apply changes (using helmfile or helm upgrade ). Your custom dashboard will be uploaded to Grafana.