How to configure Alertmanager
This article is about prometheus-operator configuration with the Prometheus and Alertmanager from the Helm package located here: https://github.com/helm/charts/tree/master/stable/prometheus-operator
Who is who
- Prometheus generating Alerts! You can find alert rules in the prometheus directory:
./templates/prometheus/rules/
You can also found it in the prometheus web interface ( /alert page ).
- Alertmanager only sort, groups, slice (part of alerts by rules) it and send alerts (via email, slack and other methods) by your routes (escalation).
Alertmanager
Here is example of basic email routing for the prometheus-operator Helm chart. You can define it in the Prometheus values.yaml file (alertmanager section):
# alertmanager configuration
alertmanager:
  # global route configuration
  config:
    global:
      resolve_timeout: 5m
    route:
      group_by: ['job']
      group_wait: 30s
      group_interval: 5m
      repeat_interval: 24h
      receiver: 'default'
      routes:
      - match:
          alertname: Watchdog
        receiver: 'null'
    receivers:
      - name: 'null'
      - name: 'default'
        email_configs:
          - send_resolved: true
            from: "[email protected]"
            to: "[email protected]"
            smarthost: "mta:25"
            require_tls: false
Here you can see 2 receivers (null and default). The default receiver has email_configs with some configuration.
Read more about alertmanager configuration, routing and receivers:
- https://prometheus.io/docs/alerting/configuration/#email_config
- https://medium.com/curai-tech/constant-vigilance-a-step-by-step-guide-to-alerts-with-helm-and-prometheus-ae9554736031
Prometheus
-
Go to prometheus /alerts page and find TargetDown rule. You can find source code for this rule at the
prometheus-operator/templates/prometheus/rules/general.rules.yamlfile. So you can create a similar yaml-files for your own rules and just add it into the same directory! -
If you want to convert existing rules from a yaml-file to the Helm template, you can use this script:
prometheus-operator/hack/sync_prometheus_rules.pyby adding your rules url:
    {
        'source': 'https://raw.githubusercontent.com/etcd-io/etcd/master/Documentation/op-guide/etcd3_alert.rules.yml',
        'destination': '../templates/prometheus/rules',
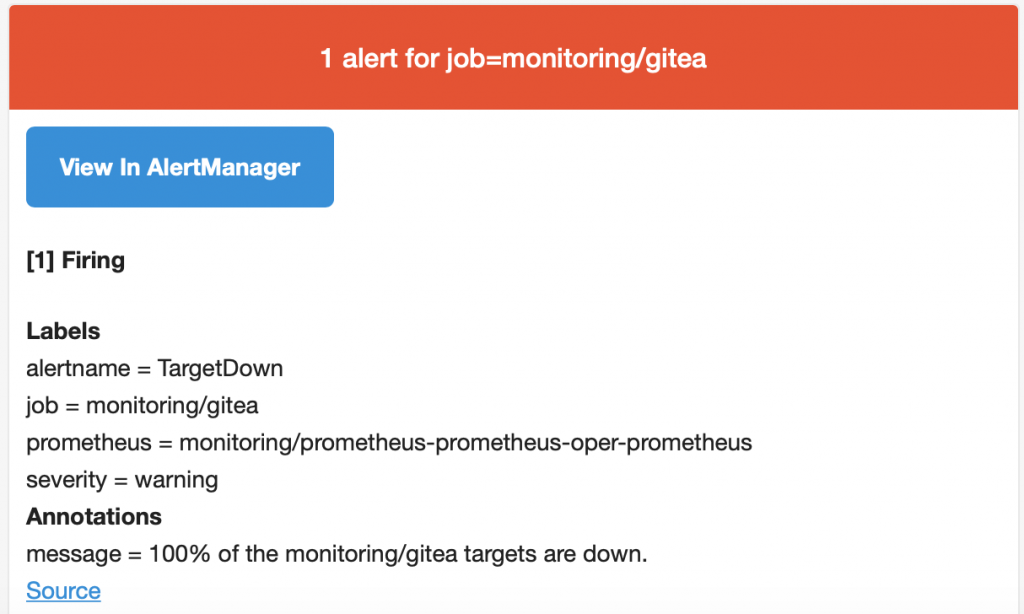
Here is an example of the TargetDown prometheus rule:
alert: TargetDown
expr: 100
  * (count by(job, namespace, service) (up == 0) / count by(job, namespace, service)
  (up)) > 10
for: 10m
labels:
  severity: warning
annotations:
  message: '{{ $value }}% of the {{ $labels.job }} targets are down.'
You can see a up == 0 expression, so you can test it by making a query:
up == 0 – will show you current instances in down state.
- Now you can turn down some pods and check whats happens.
- First of all it will be in the
PENGINGstate (because rule has a 10 minutes timeout). - Then it brings it up to
FIRINGstate. And you can find it in the alertmanager /alerts page. - After it you can check your mta logs and your mailbox.
- First of all it will be in the